Aim The aim of this blog is to introducing how to solve the problem in final project of module 1. Microsoft sees all the big companies creating original video content, and they want to get in on the fun. They have decided to create a new movie studio, but the problem is they don’t know anything about creating movies. They have hired you to help them better understand the movie industry. Your team is charged with doing data analysis and creating a presentation that explores what type of films are currently doing the best at the box office. You must then translate those findings into actionable insights that the CEO can use when deciding what type of films they should be creating.
Questions for the visualization graph I make three main questions to solve the problem in this project.
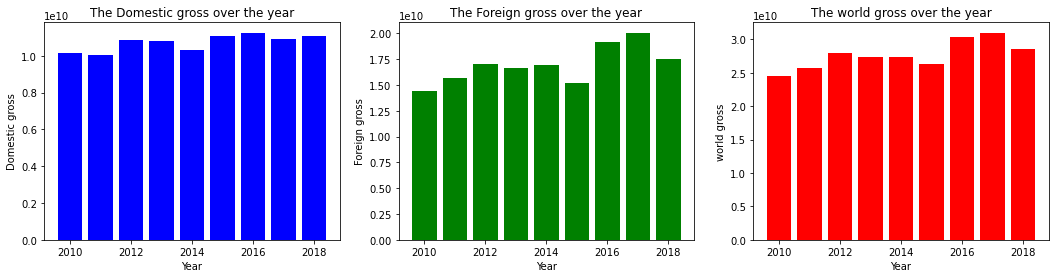
- How does movie industry growth in these years? Print the graph of the domestic gross and foreign gross as well as the world gross for different years.
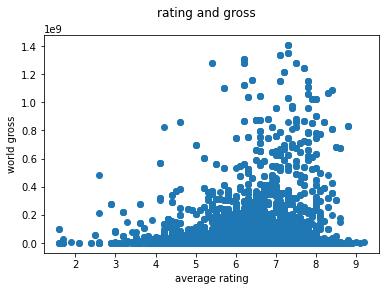
- What is average rating as well as the gross earning for different category movies? Print out the relationship between rating and gross earning?
- What is the total gross and rating of moives making in world for different genres? What is the distribution of top 200 movies which highest earned gross or highest rating. What is the number in 2018?
Results After evaluated the database, I will use the title, rating, gross, year, genres information. I slected the data from bom_movie_gross, IMDB_basics and IMDB_rating. Then I combined them into a new dataframe.
- First, I checked the market of all the movies from 2010 to 2018.
The total domestic gross did not change much. However, the foreign gross increased in general. Also, the total amount of foreign gross of all movies is almost two times larger than the domestic gross.
- Second, I plot the sctters of rating and gross for all the movies. The scatter of rating and gross earning for each movie from 2010 to 2018 shows that there is no obvious relationship between the world gross and rating of the movies. However, most of the high earning movie had high rating more than 6 but less than 9.
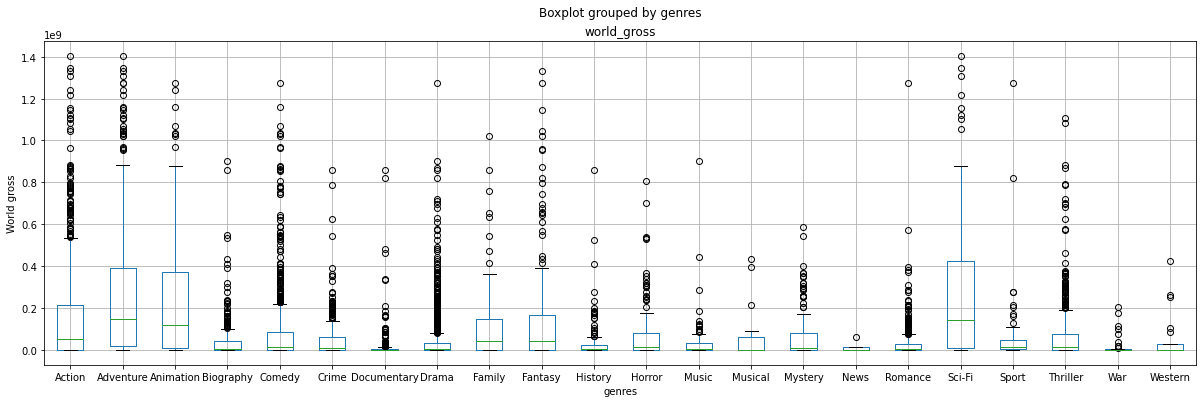
- Third, I combined the data from bom_movie_gross and IMDB_basics by matching the tiltes. I then did the boxplot to all the movies seperated by different genres.
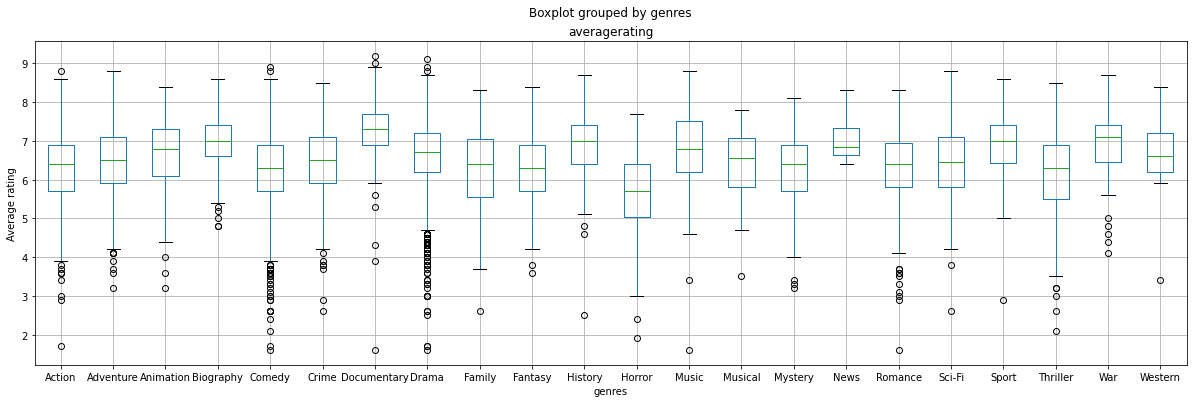
The boxplot show that the medium value of world gross for each genre’s movies are less than 0.2e+09. In general, the top four genres based on gross are adventure, animation, Sci-Fi and action. There are a lot of movies in these genres earned more than 0.6e+09 which is more than other genres. For the average rating, there is no significant different types of movies are higher than others. This suggests that there is more chance to earn more money if we select movies in one or more of adventure, animation, Sci-Fi and action genres.
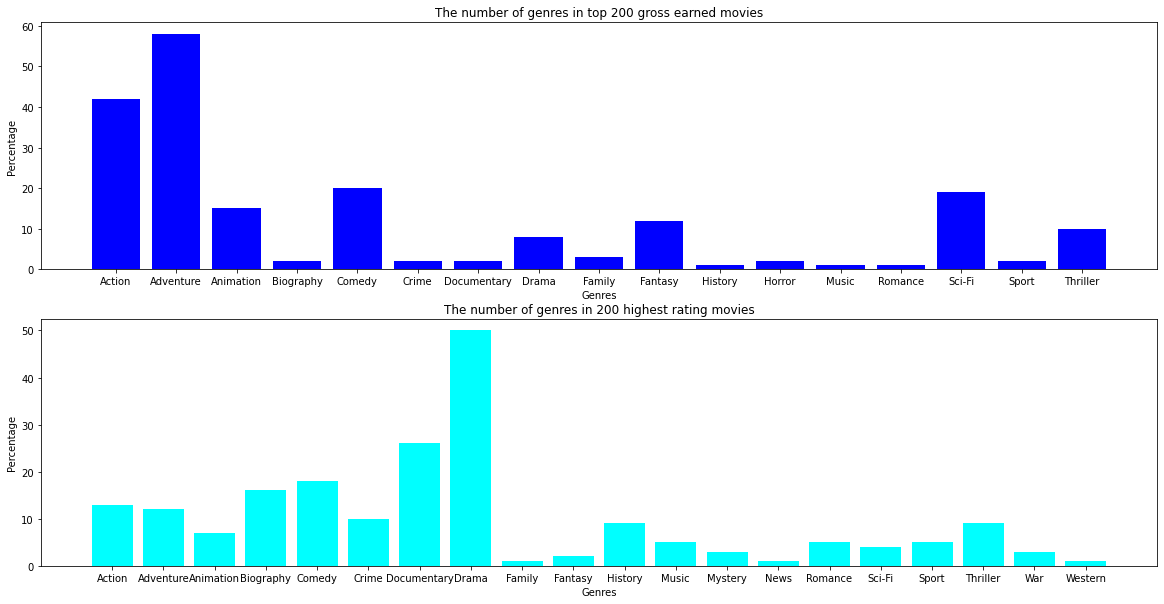
Next, I plot the the number of genres in 200 highest gross earned and rating movies seperately.
The histograms show that in the top 200 gross earning movies, more than 25% of them are adventure movies and more than 20% are action movies. In the top 200 rating movies, 25% are drama movies and 14% are documentary movies. action and adventure movies take about 6%.
In 2018, The adventure and action earned more money than others.
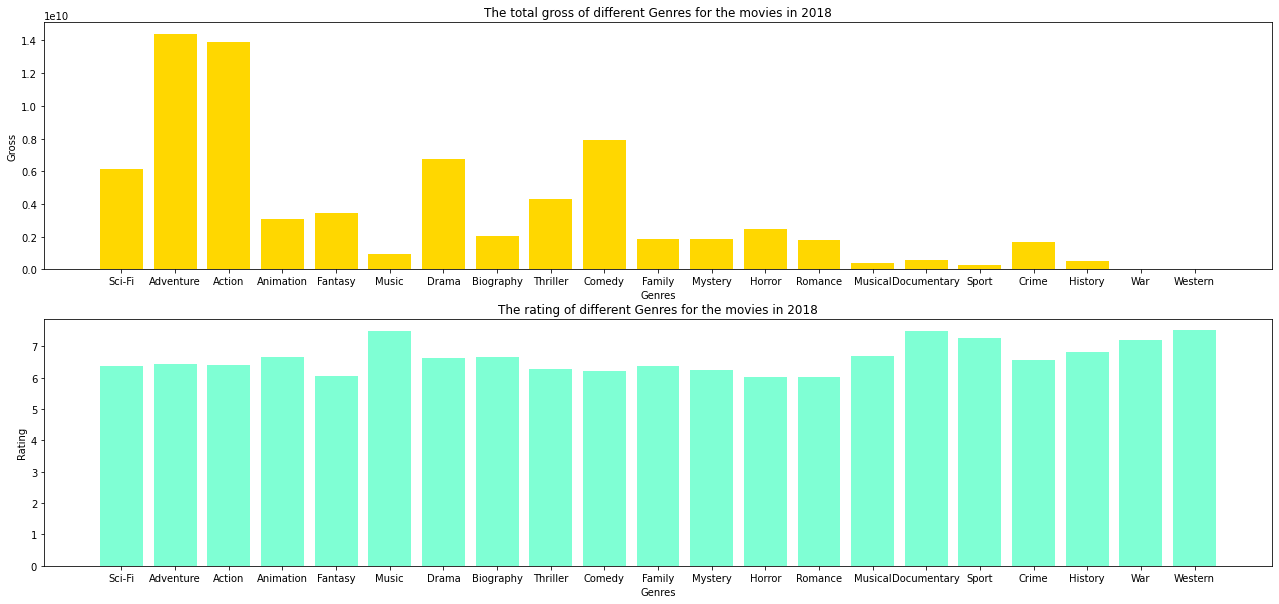
In general, the Adventure and Action movies earned more money than other types of movies. If we want to focus on the earning of the movies, choosing adventure or action or the mixture types containing these genres is a good choice. Also, the rating for these two types are above the average. If we want to focus only the high rating, seleting drama and documentary movies is good choice.